Tracking useful ecommerce metrics is essential to your ability to make informed, data-based decisions and grow your online brand. But the question is—which ecommerce metrics should you be paying closer attention to?
Of course, you’ll want to focus on ecommerce KPI or metrics that will have the most significant impact on your ecommerce website’s bottom line.
That’s what most ecommerce marketers also aim for.
But often, many of them wind up tracking “vanity metrics” such as social media “likes”, page views, or unqualified leads in the sales funnel, that have little to no effect on their overall business performance.
In this post, we’ll go through the top seven ecommerce metrics that every ecommerce marketing manager should be tracking. We’ll explain what these metrics mean, why they’re so vital for your marketing strategy, and more.
Read on…
Benefits of Tracking the Right Ecommerce Metrics
The key to successful ecommerce marketing is tracking the right metrics. It allows you to:
- make informed adjustments to content, design, and marketing plans
- improve the customer experience and boost your conversion rates
- anticipate changes in product demand and optimize inventory levels accordingly
- analyze the impact of new marketing channels on existing revenue streams
- and take many other smart ecommerce marketing decisions
What are the Top Ecommerce Metrics to Track?
Some ecommerce metrics may seem to be more critical than others, but the reality is, it depends on your company’s business objectives and strategy. What your competitors are tracking might not be relevant to you; what works for one company may not work for another.
However, our list of top ecommerce metrics are usually the most important ones to focus on regardless of your industry:
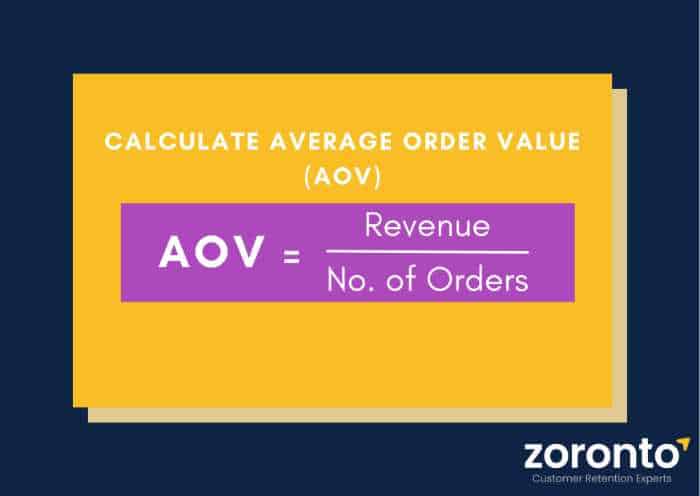
1. Average Order Value (AOV)
Definition: Average Order Value (AOV) means the total average amount that all customers spend on just one purchase. It is calculated as the total revenue for orders divided by the number of orders.
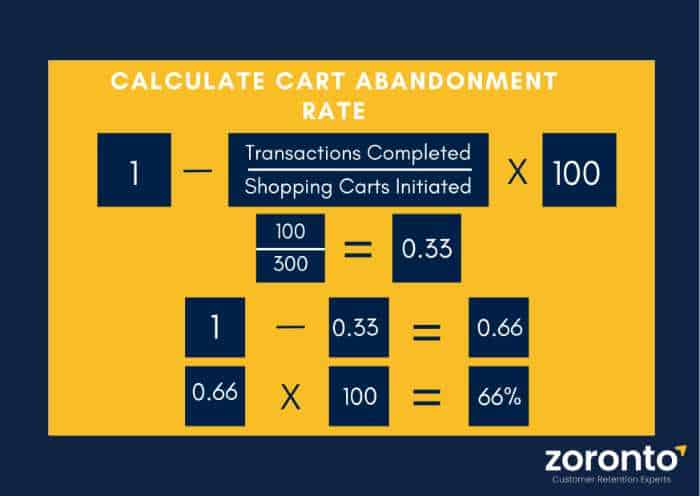
Why Measuring Cart Abandonment Rate is Important
Cart abandonment is a huge problem for online stores. Customers add products to their carts but don’t complete the transaction.
According to Baymard, estimated that nearly 70 percent of shopping carts are abandoned on average. This means that roughly seven out of ten people who add products to a shopping cart fail to make a purchase.
As a marketer, you must try to focus on this ecommerce KPI, determine why customers aren’t moving beyond the cart and take steps to fix the problem.
If not, you will continue losing revenue from lost sales.
How To Track on Shopping Cart Abandonment Rate Using Various Tools
There are many ways to measure how many times customers add items to their cart but do not convert. One of them is by setting ecommerce metrics on Google Analytics.
To set up shopping cart abandonment cart rate tracking on Google Analytics, here’s what you need to do:
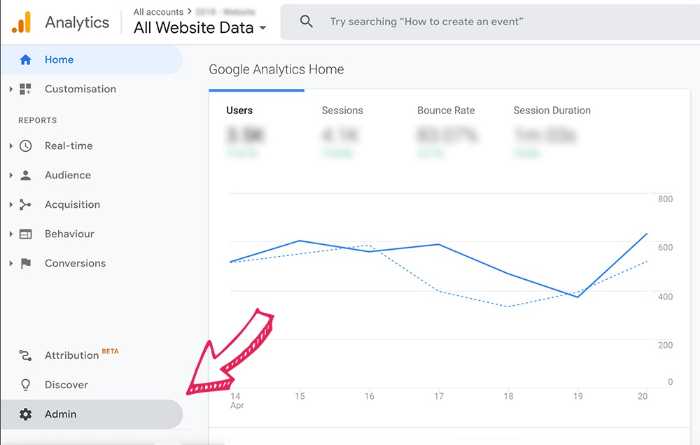
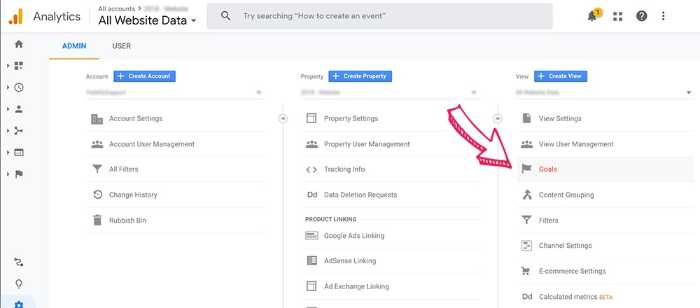
Step 1: Navigate to the Goals Tab
To begin tracking your visitors’ shopping cart abandonment rate, you need to set up a Google Analytics goal. To do this, navigate to the Tools tab in your Analytics settings and select “Goals” under the Goals Column.
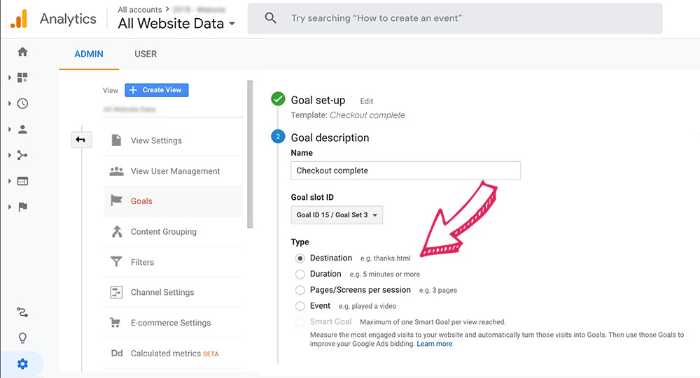
Step 2: Set Up Your Shopping Cart Abandonment Goal
Once you are on the goals page, click the “Create Goal” button to begin. And select Checkout Complete.
Then, the first thing you need to do is name your goal. Call it something simple, like “Shopping Cart Abandonment.”
After naming your goal, Google Analytics will ask what type of goal you wish to set up. Select the last option: “Destination.”
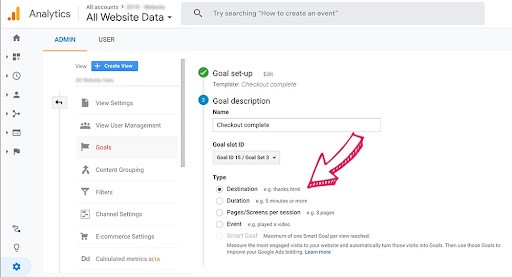
Then, you need to type the URL of your shopping cart checkout page into the field that Google Analytics brings up. This is typically something like
www.yoursite.com/checkout/5746579
Click “Apply” when finished.
Finally, click “Verify” to make sure everything is working properly.
You will see a new “Goal Details” section under your shopping cart abandonment goal. You can use this to measure how many people reach your checkout page but don’t convert.
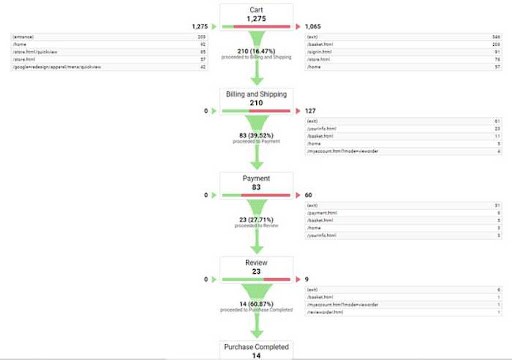
You need to have ecommerce funnel metrics to see the buyer’s journey till cart abandonment.
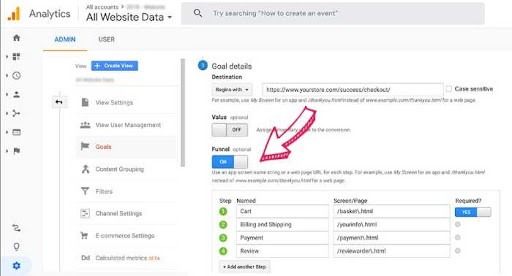
What your ecommerce funnel visualization would look like:
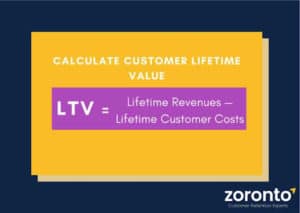
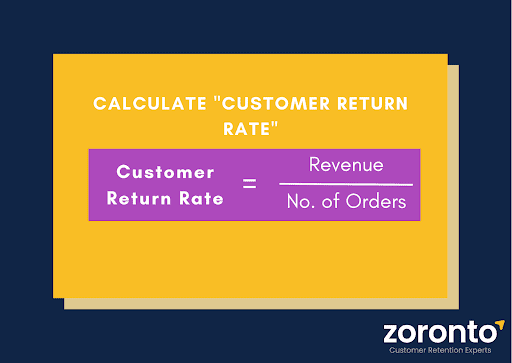
4. Customer Lifetime Value (LTV)
Definition: The total amount of revenue generated by one customer over the course of their entire journey with your company. It can be calculated with the below formula:
Why Tracking Customer Lifetime Value is Important
Customer lifetime value is important because it allows you to gain insight into how much money your business will generate from each individual customer throughout the course of their relationship with your company. It can be in the form of repeat purchases or even referrals to new customers.
Benefits of Measuring Customer Lifetime Value
The other advantages of measuring customer lifetime value are that it allows marketers to:
- calculate future profits from individual customers or specific market segments
- devise strategies for targeting similar prospects who can stay with you longer
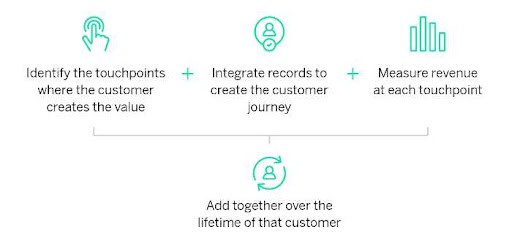
How to Measure Customer Lifetime Value
Many companies have a difficult time measuring customer lifetime value. Some might think that the difficulties lie in establishing the process, but in reality, it’s simply a matter of taking the right steps.
You can find a customer lifetime value graphic showing the steps to measure CLV:
5. Repeat Customer Rate
Definition: Repeat customer rate is the percentage of customers who have purchased from your ecommerce store more than once.
Repeat Customer Rate = (Number of recurring transactions) / (number of total transactions)
Why Tracking Repeat Customer Rate is Important
Tracking repeat customer rate is crucial because it can give you a sense of how well your store is retaining customers. If your repeat customer rate is low, that may indicate that you need to improve your customer retention strategy.
How to Improve Your Repeat Customer Rate
There are several ways to improve your ecommerce store’s repeat customer rate. Some of the most effective methods include:
- Creating a loyalty program that rewards customers for their loyalty
- Offering discounts to customers who have made multiple purchases
- Improving the customer experience to make it more enjoyable and engaging
- Developing targeted marketing campaigns specifically designed to attract returning customers
- Providing excellent customer service to ensure that every customer’s needs are met
- Using customer analytics to track and analyze customer behavior
The bottom line is that if you want to improve your ecommerce business, you need to focus on retaining your current customers. The more you can make them happy and keep them coming back; the more successful your store will be.
How to Measure Repeat Customer Rate with Klaviyo
With Klaviyo, You may make a segment of buyers who have placed an order more than once (basically, your repeat customers), and you do have the option to apply a timeframe.
A repeat buyer segment is a set of customers who have returned to buy from your company after their first purchase. This allows you to learn more about your clients’ buying habits and customize your marketing accordingly.
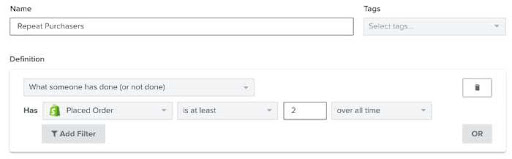
Creating a Repeat Purchase Segment:
When creating a repeat purchaser segment, include the following conditions:
Customer activity > Has Placed Order > is at least 2 > overall time
More Targeting Options
1. Adjust Timeframe
You may also change the time frame; for example, you can isolate buyers who bought a specific number of times on particular days or months rather than identifying purchase activity for the entire time.
2. Add a Filter
You may even identify repeat purchasers of a particular product or those who have purchased from a specific category.
3. Add Additional Conditions
To make a group of repeat purchasers on a specific list, add the “Additional Condition” to your segment. You may further narrow this group by adding as many additional conditions based on the customer behavior.
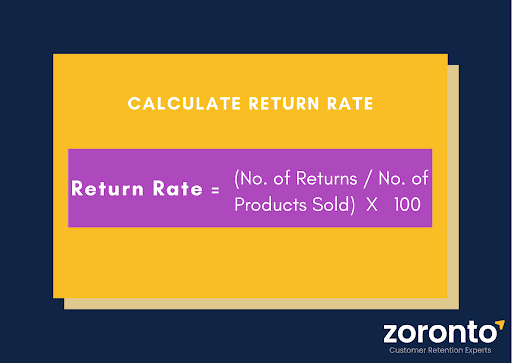
6. Average order return rate
Definition: The average percentage of customers who return an item for a refund or exchange.
Common causes of high average return rate
Customers frequently return items to retailers because of a variety of factors such as:
- Incorrect size: When the consumer receives a product that isn’t appropriate size as described.
- Incorrect description: When the purchased item does not match the displayed description in terms of style or color.
- Damaged product: Before or during the shipping process, if the delivered item is damaged, it is returned.
- Malfunctioning product: When the supplied products are not on par with the quality described
Why It’s Important to Track Ecommerce Return Rate
Measuring your return rate is crucial because it gives you insight into the quality of your products and services. It also lets you know if your business is meeting customer expectations.
A high return rate can be a sign of damaged or malfunctioning items, meaning that the retailer’s supply chain may need to be improved, or inaccurate descriptions and sizes may mean that there’s a problem with their product descriptions or sizing charts.
On the other hand, a low return rate could mean that customers are happy with their item choices and have an accurate understanding of how to choose the right size. It also means that they’re happy with your product quality.
If you have a high return rate, it may be time to reassess your product lines, supply chain, and product descriptions.
So you need to measure this because it influences long-term revenue. And high returns affect the conversion rate impacting your bottom line.
How to Manage Ecommerce Return
To measure return rates for any ecommerce business, you need to have a way to identify how many orders were refunded or returned.
The way is simple: you simply need to monitor your orders to figure out how many of them were refunded or returned.
Since most ecommerce platforms do not provide that information, you need to use external software (or a spreadsheet) that can track and measure the numbers. Once you’re able to do that, managing the returns becomes easier. To take care of the returns effectively on a Shopify store, you can use the Shopify app, Returnly.
You get everything you need to automate and manage your returns with the Returnly App. Returnly works with Shopify purchases and provides a self-service Returns Center for your business.
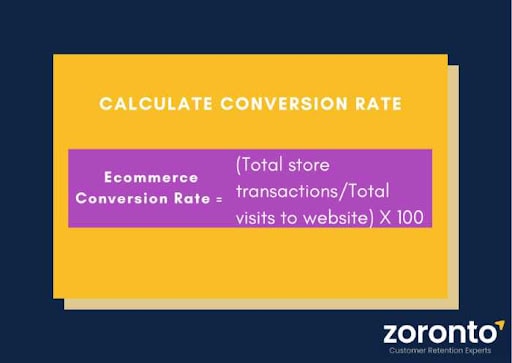
7. Overall Ecommerce Conversion Rate
Definition: The overall number of first-time buyers as a percentage of visitors.